
What do the different FROG techniques' traces look like?
PG FROG traces (see the figure at right) look a lot like spectrograms because the gate function in PG FROG is the pulse intensity, so it contributes no phase to the signal pulse. This is in contrast to SHG FROG, in which the gate function is the pulse electric field, which includes the full phase of the pulse.
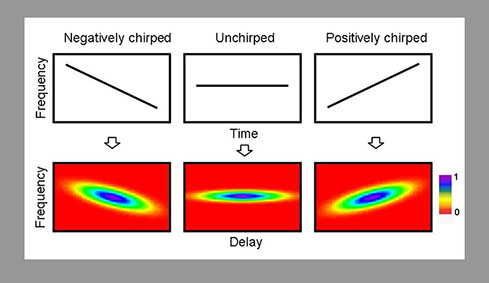
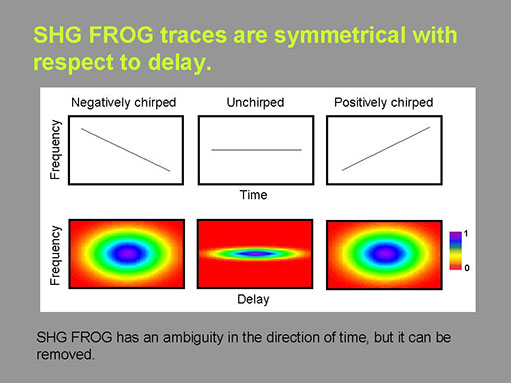
As a result, SHG FROG traces (left) are always symmetrical with respect to delay. The result is that SHG FROG cannot distinguish a pulse from its time-reversed self. Notice that it cannot distinguish a positively chirped pulse from a negatively chirped one. This isn't so bad, however, as adding a simple piece of glass into the beam and seeing if the trace gets fatter or skinnier resolves the ambiguity.
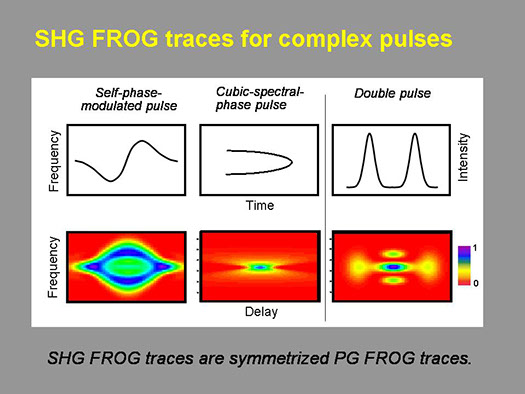
But SHG FROG can measure just about everything else about a pulse. And the pulse-shaping community uses SHG FROG to measure their pulses. At right are SHG FROG traces for other types of distortions. Also, this symmetry in SHG FROG traces can be an advantage, allowing it to measure all the first-order spatio-temporal distortions!
It doesn't matter what the traces look like; the appropriate FROG algorithm can retrieve the pulse from them. But most are are at least somewhat intuitive.