
How is a pulse retrieved from a FROG spectrogram?
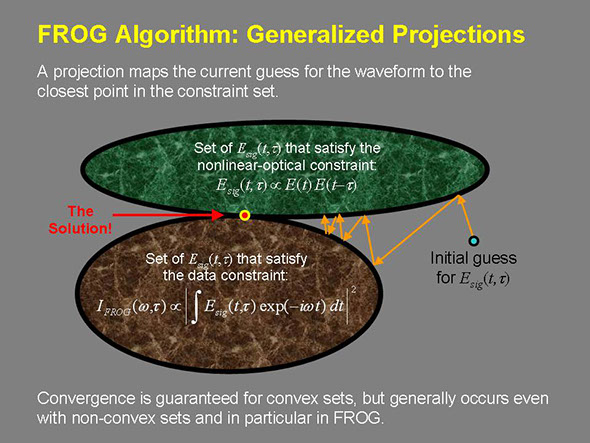
Think of the image at left as a Venn diagram of all possible pulses. The elliptical regions are the two constraint sets (the measured trace and the knowledge of the mathematical form of the nonlinear effect). The pulse is found by making projections to each set alternatively. It is very robust. See our 1994, 1995, and 2008 articles for more details.